


Description: We design high converting infographic images that turn complex product information into simple visual stories. Most Amazon shoppers never read bullet points. They scroll through the image stack making split second decisions. Our infographics highlight key features, answer objections, and communicate value instantly so your product wins the click and the sale.
Project Highlights:
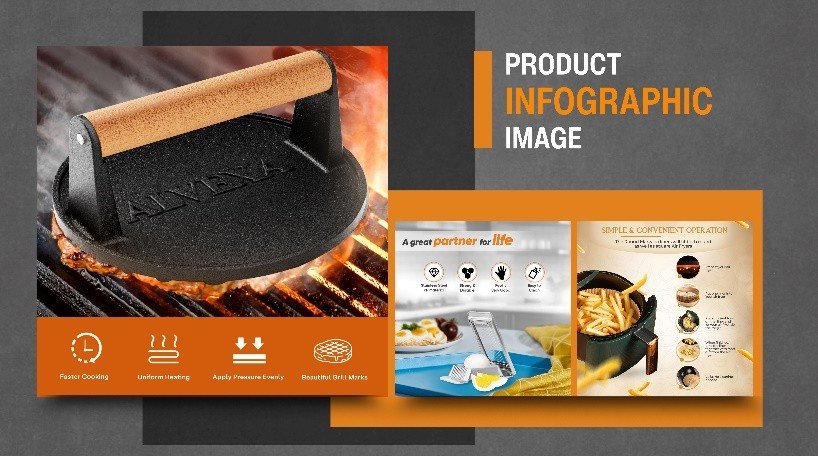
Features Turned Into Visual Benefits
Shoppers don’t want technical specs. They want to know how your product improves their life. Our infographics translate features into clear benefits using icons, callouts, and visual comparisons that customers understand in seconds.Higher Conversion Rates
Listings with strong infographic images consistently outsell those without. Our clients see conversion rate lifts of 15% to 30% because shoppers feel informed and confident enough to click Add to Cart without reading a single bullet point.Reduced Product Returns
Returns often happen when expectations don’t match reality. Our infographics set accurate expectations through dimension callouts, material breakdowns, size guides, and usage visuals. Customers know exactly what they’re getting before they buy.Mobile Optimized for Thumb Scrollers
Over 60% of Amazon shopping happens on mobile. We design every infographic with large readable text, bold icons, and uncluttered layouts that remain clear when viewed on small screens. If it doesn’t work on mobile, it doesn’t work at all.Complete Image Stack Strategy
We design the full sequence of infographics to tell a logical story. Image one grabs attention. Image two highlights the top benefit. Image three handles a common objection. Every image earns its place in the stack and moves the shopper closer to purchase.


How We Solve This Project
We Identify What Shoppers Need to Know
Before designing, we study the product category, customer reviews, and frequently asked questions. We identify the top three to five pieces of information that matter most to buyers and build infographics around those priorities. No fluff, just what sells.We Turn Text Into Visuals
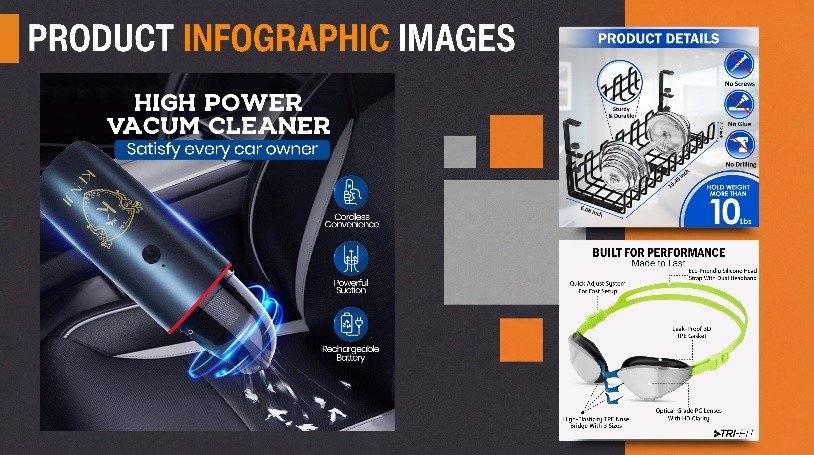
Bullet points like “durable stainless steel construction” get ignored. We turn that same information into a visual showing material layers, strength comparisons, or corrosion resistance callouts. Shoppers process visuals faster than text, and faster understanding means faster buying decisions.We Use Comparison Charts to Prove Value
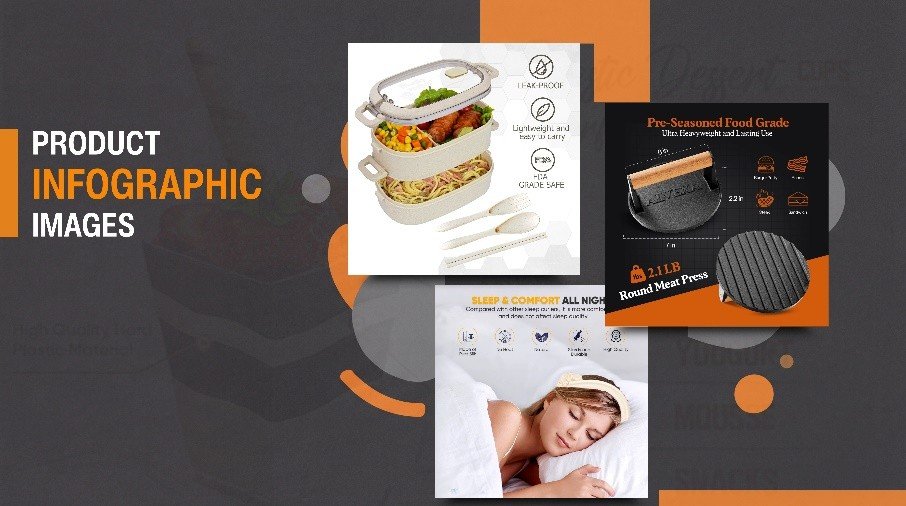
Why should a shopper choose your product over competitors? Our comparison table infographics position your product against generic alternatives, highlighting superior features, better materials, or added value. The visual contrast makes your product the obvious choice.We Create Dimension and Size Graphics
One of the top reasons for returns is size misunderstanding. We design clear dimension callout graphics showing product measurements, scale references, and size guides so customers know exactly what they’re ordering. Fewer surprises mean fewer returns.We Design Problem Solution Visuals
Every product solves a problem. Our infographics visually communicate the before state, the solution your product provides, and the after result. This simple storytelling framework helps shoppers instantly understand why they need your product and why they need it now.We Deliver a Cohesive Stack That Guides the Sale
A random collection of infographics confuses shoppers. We design the complete image stack with consistent colors, fonts, and styling so the experience feels professional and trustworthy. The sequence moves shoppers logically from awareness to interest to purchase, maximizing your conversion rate at every step.


